
1. Historical Context of A-Share Market Trends
1.1 The Record-Breaking 11-Day Rally
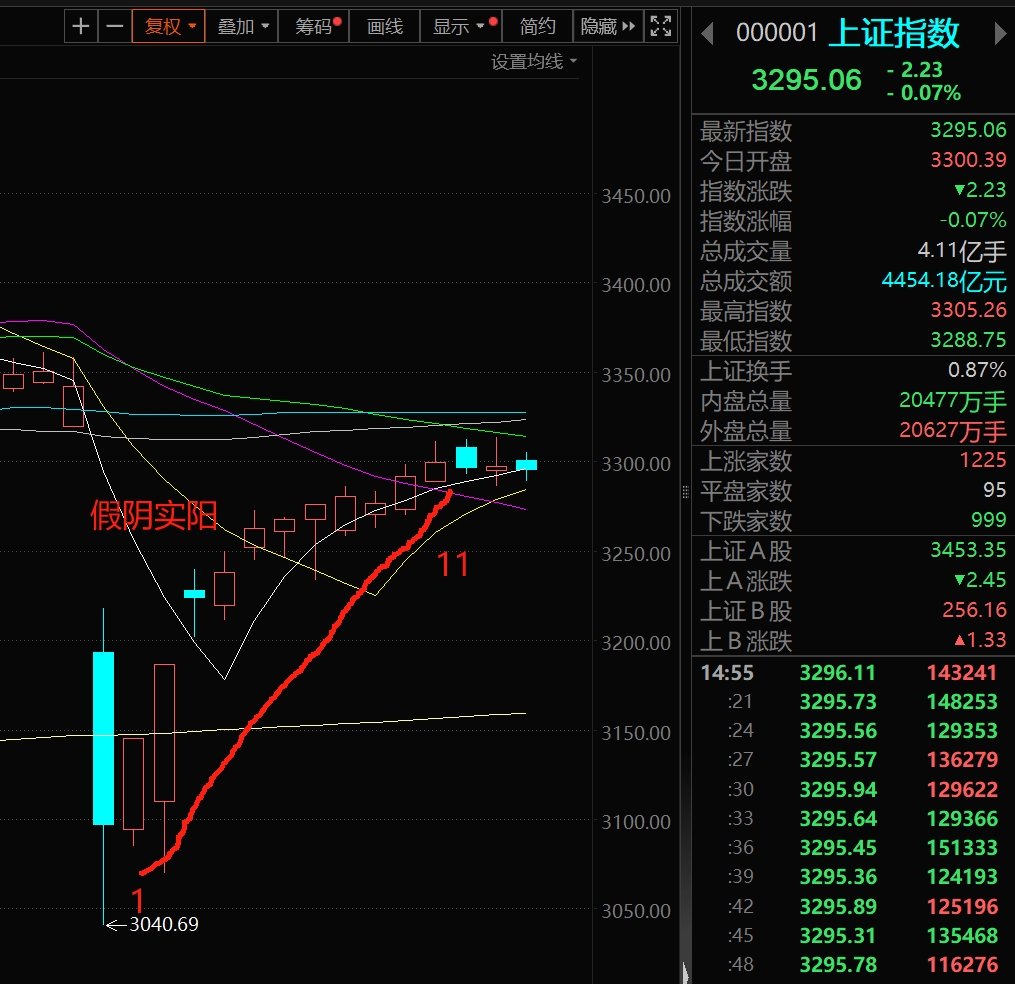
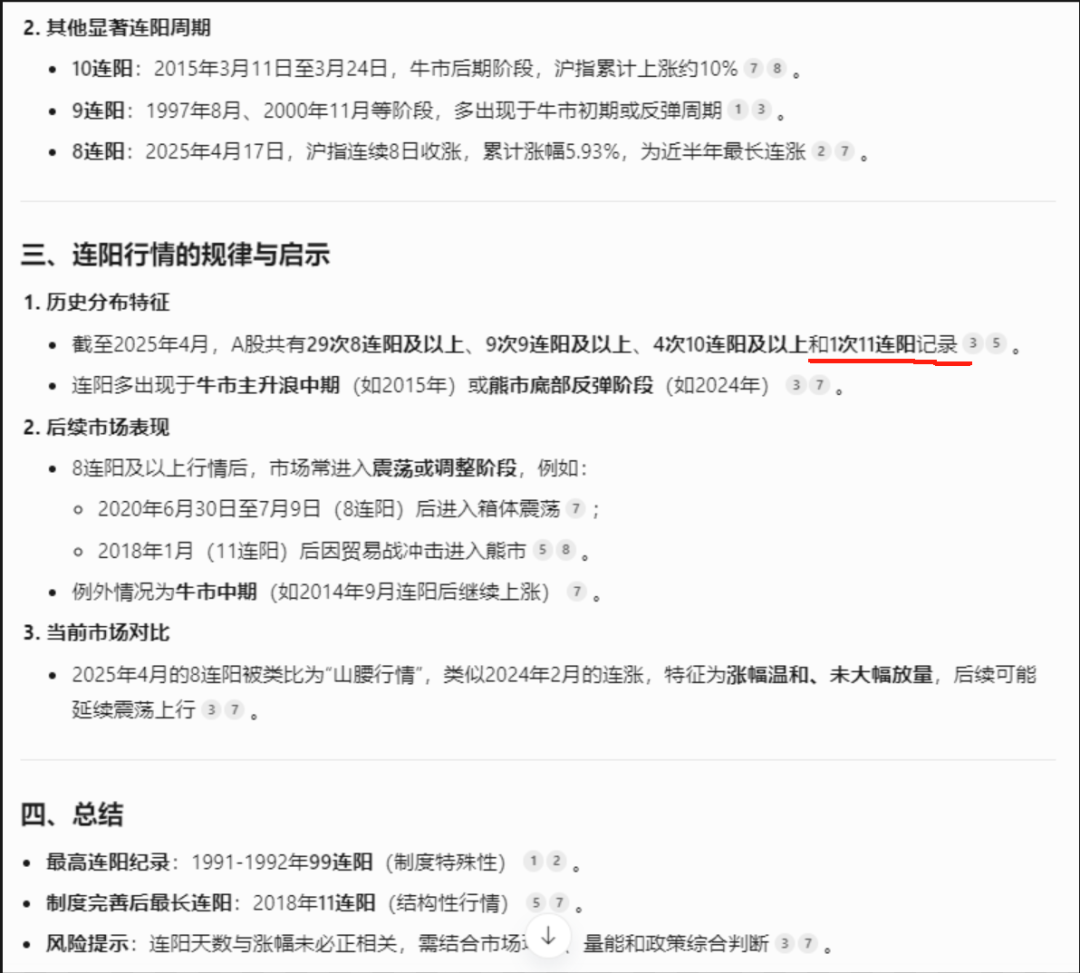
The A-share market’s recent 9-day consecutive rise (ending last week) revived memories of its historic 11-day streak—a milestone achieved only twice since the 1990s:
- 2006 Rally: Coincided with full circulation reforms, marking a watershed moment in market liberalization.
- 2025 Echo: Matched the 2006 peak, underscoring institutional confidence in controlled growth.
Unlike the 1990s’ 99-day speculative frenzy, today’s market operates under strict regulatory oversight. The 11-day streak reflects a new era of “stability-first” growth, where volatility is a managed variable.
1.2 Technical Signals and Market Psychology
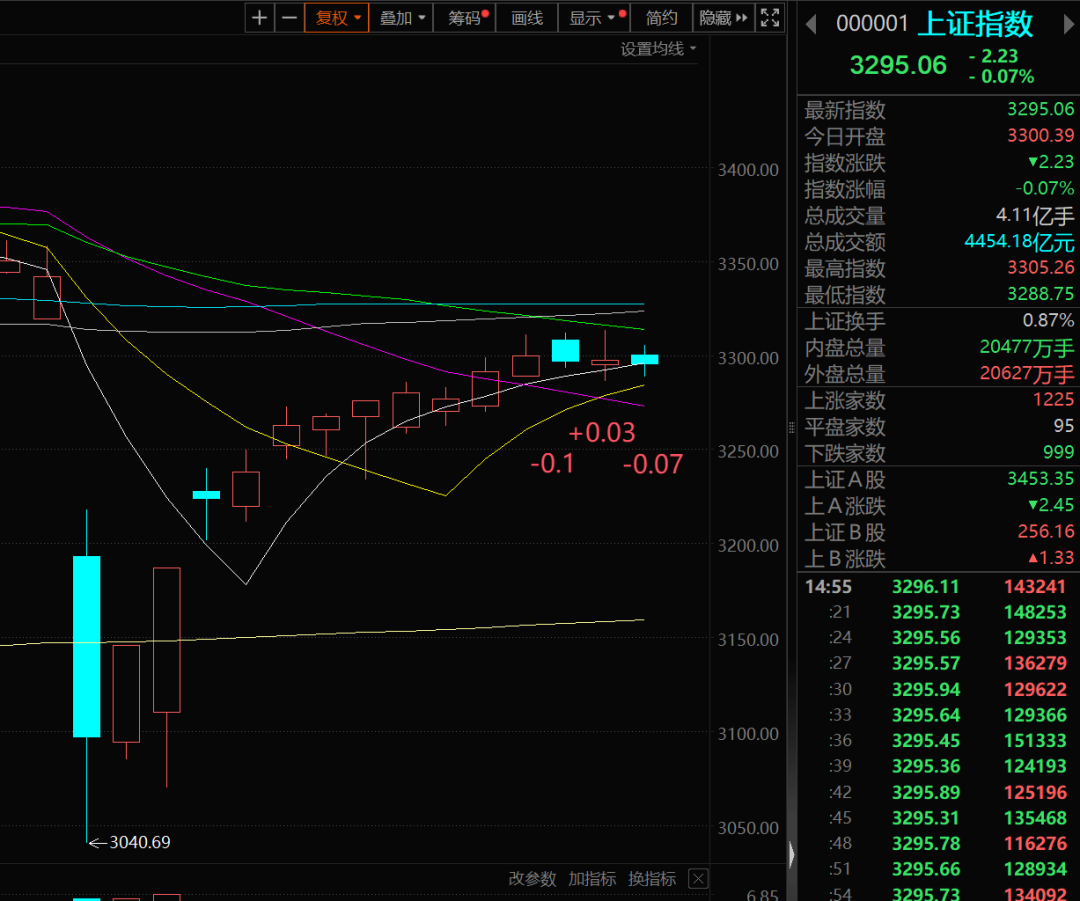
Post-rally corrections reveal strategic intent:
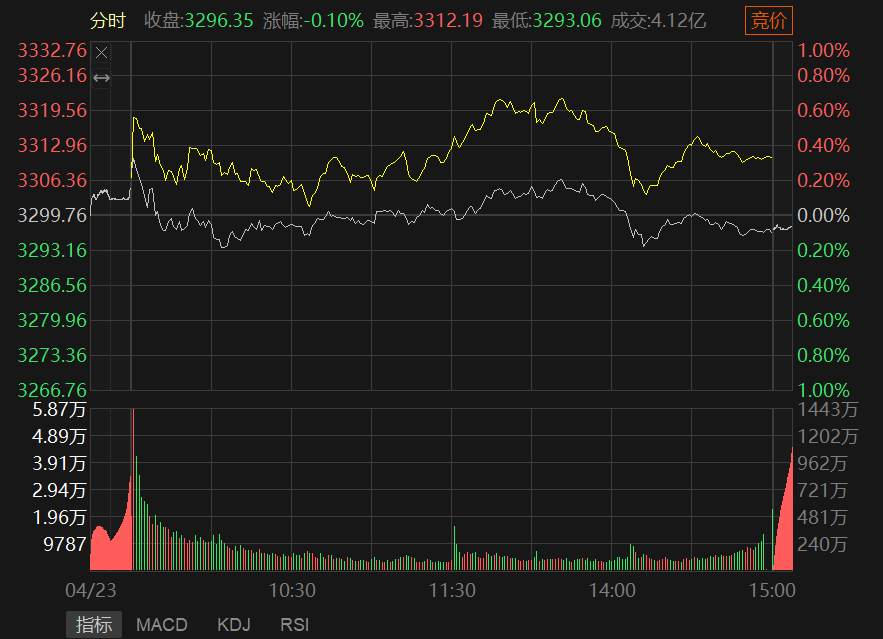
- Day 12: -0.1% decline—a “speed bump” to cool overheating.
- Day 13: +0.03% gain—institutional buyers absorbed selling pressure.
- Day 14: -0.07% retreat—a controlled reset before the next phase.
These micro-movements signal two things:
- Precision Control: The “National Team” (state-backed funds) engineered a soft landing, avoiding panic selling.
- Psychological Warfare: Ending at 11 days discourages FOMO-driven speculation, aligning with regulatory goals.
2. Market Dynamics: State Influence and Investor Behavior
2.1 The Role of Institutional Investors
The National Team’s playbook prioritizes longevity over quick wins:
- Price Capping: Keeping the Shanghai Composite below 3,000 points prevents irrational exuberance.
- Liquidity Moderation: Trading volumes stayed below 1.5 trillion CNY/day, avoiding the “2015-style” bubble.
This approach reduces systemic risks and discourages day-trading—a win for both stability and retail investors.
2.2 Retail Investor Considerations
For individual traders, the current climate offers:
- Lower Volatility: Smaller price swings mean fewer margin calls and easier position holding.
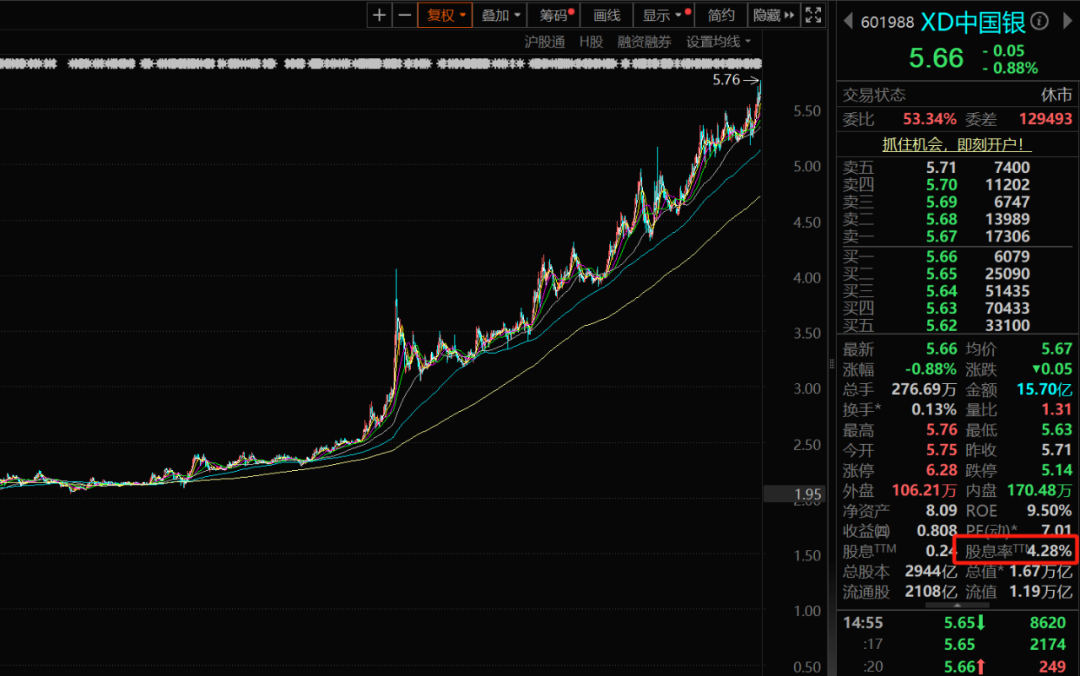
- Sector Rotation Alerts: Bank stocks’ 75% surge over two years signals a shift to undervalued sectors.
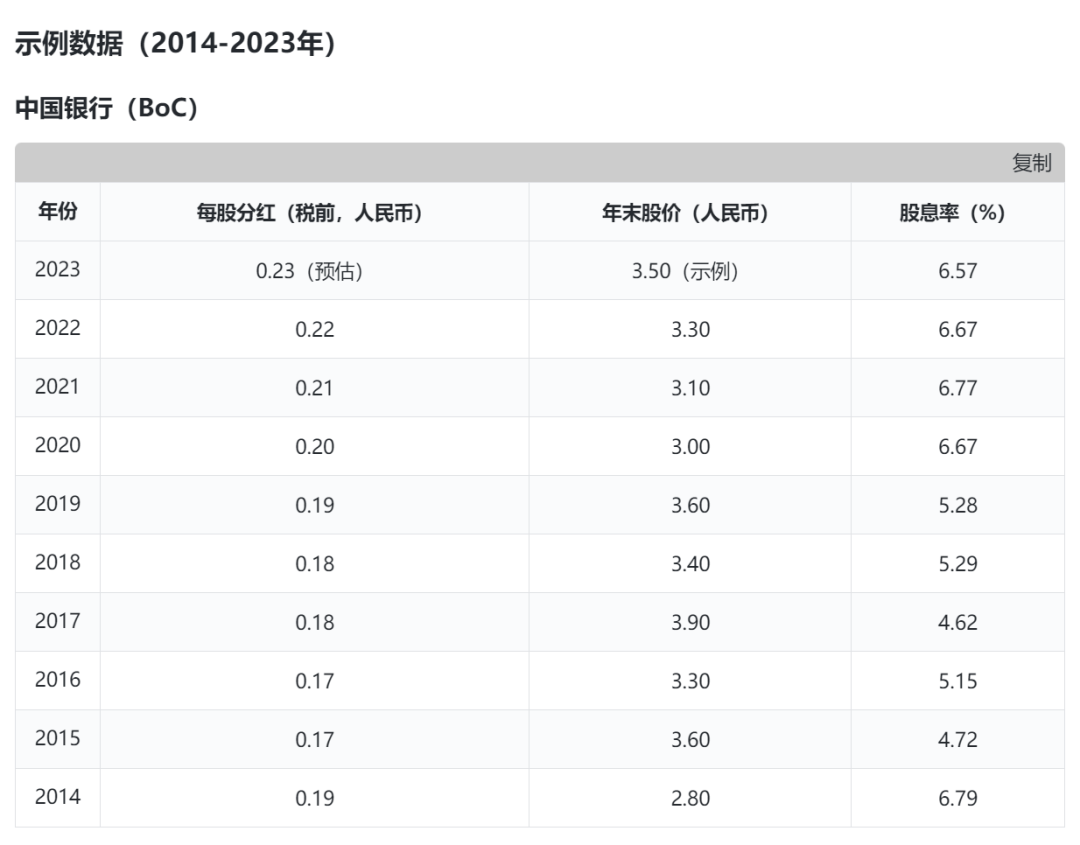
Example: Industrial and Commercial Bank of China’s (ICBC) dividend yield fell from 7% to 4% as prices doubled—a warning sign for yield-chasing investors.
3. Banking Sector: From High Dividends to Valuation Concerns
3.1 The Rise of Bank Stocks
Two factors propelled banks:
- Carry Trade Allure: Institutions borrowed at 2.25% to buy 6%+ yielding bank shares.
- Regulatory Backstop: Central bank liquidity measures prioritized systemically important banks.
3.2 Current Valuation Risks
However, the sector now faces:
- Yield Compression: ICBC’s dividend yield dropped to 4% as prices surged, losing edge over tech stocks like Midea Group (4.79% yield).
- Growth Limits: Banks’ 5% annual profit growth can’t justify further price gains. Investors will rotate to sectors with 15%+ CAGR potential.
4. Macroeconomic Factors Shaping the Market
4.1 Trade Policy and Global Linkages
Despite U.S.-China tensions:
- Export Resilience: China’s U.S. export dependency fell from 19.2% (2018) to 14.7% (2024).
- Diversification Wins: ASEAN and EU now account for 30% of exports, while cross-border e-commerce hit $369B in 2024.
4.2 Monetary Policy and Capital Flows
Key trends:
- Rate Dilemma: China’s 2.25% benchmark rate attracts equity flows but compresses bank margins.
- Foreign Interest: MSCI inclusion drove $1.2T in foreign A-share holdings by 2024.
5. Strategic Insights for Investors
5.1 Navigating the Current Landscape
Actionable tips:
- Quality Over Quantity: Target utilities (5%+ yields) and consumer staples with stable cash flows.
- Avoid Overcrowded Trades: Trim bank exposure and add green energy or AI stocks.
5.2 Long-Term Opportunities
Future growth engines:
- Digital Economy: Asia’s e-commerce sector grew 8.4% in 2024, led by Alibaba and JD.com.
- Regional Integration: RCEP boosted intra-Asia trade by 3%, benefiting logistics firms like SF Express.
6. Conclusion: Stability Amid Uncertainty
The A-share market’s 11-day rally was a masterclass in controlled growth—a balancing act between regulatory goals and market forces. While institutional players ensure short-term stability, long-term success hinges on:
- Structural reforms to boost productivity.
- Global cooperation to mitigate trade risks.
- Sector rotation to maintain momentum.
By understanding these dynamics, investors can navigate the A-share market with confidence—even amid global uncertainty.
Note: All data uses 1 USD = 7.2 CNY exchange rate. Sources include World Bank, Boao Forum, and market reports.